
Created 18 March 2016
Last updated 2 December 2016
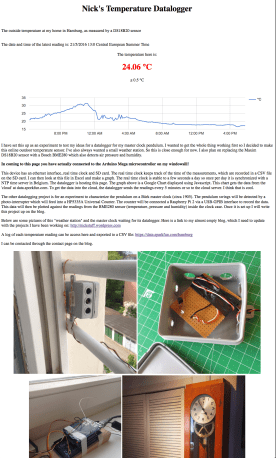
For many years I have wanted to set up a small weather station using an Arduino microcontroller . Recently I have resumed work on my clock pendulum characterization project. That project includes the need to measure and record the temperature, pressure and humidity inside a pendulum clock case. In preparation for that project I decided to experiment with and setup a temperature data logger using an Arduino and parts that I had on hand.
This has been a very interesting little ‘sub’ project and includes the following features:
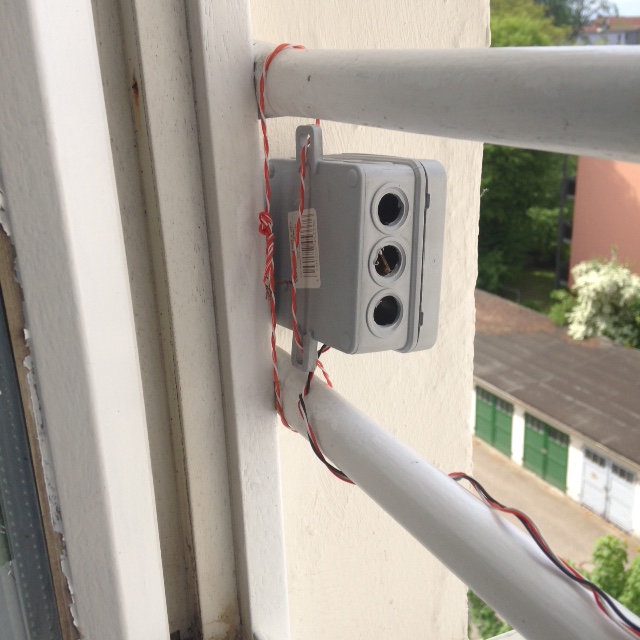
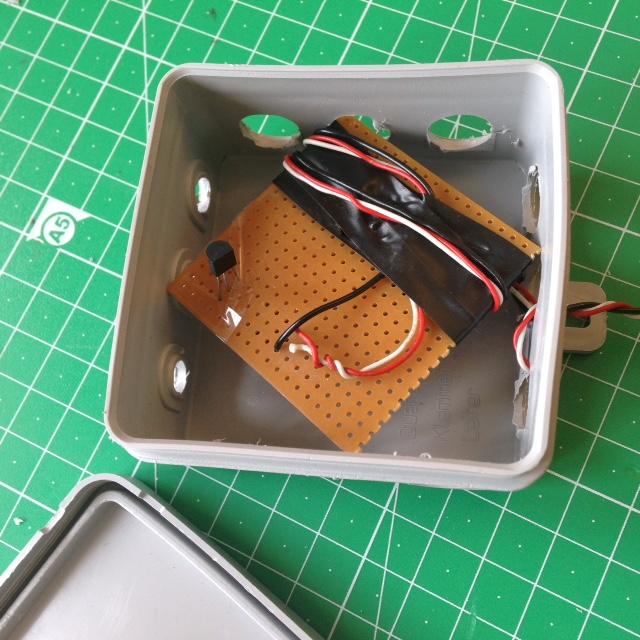
- DS18B20 digital onewire temperature sensor
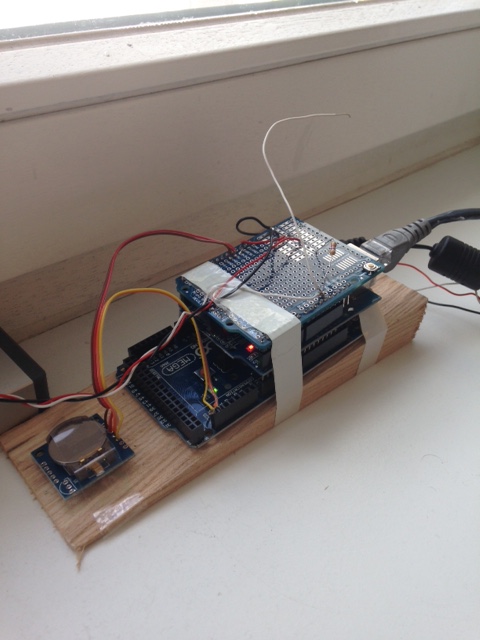
- DS1307 real time clock
- SD card to store a CSV format log file
- daily synchronization of the real time clock with an NTP server to keep it on time
- ethernet connectivity of the Arduino Mega microcontroller
- webserver on the Arduino to display the current temperature and a historical chart
- automatic upload of temperature data to a Phant telemetry server (viz data.sparkfun.com)
- Google Charts graphing of data embedded in the Arduino hosted webpage
You can view the little Arduino hosted website by clicking here.
[UPDATE 2/10/2017: There is an ongoing issue with the link above that links to the Arduino hosted webpage. For some reason, that I am yet to investigate, the Arduino becomes unavailable when attempting to access its webpage. When I restart it it works fine. I don’t know how long until it falls over. I am sorry about this. When I have more time I will investigate the issue.]
[UPDATE 1/12/2016: While the above link to my Arduino temperature sensor web page is working, the Google Chart is still only representing old data from before my relocation. I believe this is being caused by problems with Sparkfun’s free Phant server. The Arduino has not been able to successfully send an update to that server and often get errors when I try and access it’s web site/interface. This is a bit sad and other have noted this on Github. Hopefully it will come good. We could solve this problem by hosting our own Phant server (see paragraph above). My own personal Phant server is not public and so the Google Charts engine would not be able to access the data for display on the chart at the above link. Let’s wait and see if Sparkfun’s Phant server comes good. Don’t be put off by any of this – host your own Phant server!]
[UPDATE 30/11/2016: The above link should be back up now. The sensor is now relocated to Australia from Germany. It seems that the data.sparkfun.com Phant server is not working well. My personal (local) Phant server is working fine with this code. This explains why the temp reading is up to date but the Google Chart is still being fed by yet to be updated Phant data at data.sparkfun.com. Hopefully they will fix it soon. Your best bet then is to run your own Phant server, which is quite easy – instructions at data.sparkfun.com]
[UPDATE 27/10/2016: I’m sorry but the above link is down. I recently relocated abroad so the Arduino has been packed a way for transport. It will be back up within the next month or two in a new climate. Sorry I didn’t put up a screen shot of how the page looked. My bad.]
Here are some photos of the DS18B20 sensor package and the Arduino with ethernet shield and real time clock mounted on a piece of wood. There’s also a low res screen shot of how the Arduino page above looks like if it is offline for whatever reason.
The Code
I am not a programmer. I have cobbled together code from a couple of sources, inlcuding the blog at Bajdi.com. The code seems to work fine, but it might be a little messy (because of my changes not Bajdi.com!). I am still learning how to programme Arduinos. If you have found any major flaws I would be interested to know. Please leave a comment below.
I would really like to know if you have found this page and work useful. Please leave a comment or send me a message via the Contact page!
There are two parts to the code. The first is the Arduino code and the second is the html page with JavaScript used to generate the temperature. However, the second part of the code is encapsulated within the Arduino code.
I modified Arduino code that I found on a post at the blog Bajdi.com (see links and References section below). In addition to this, I added code to send the data to the Phant server using http post requests (see the spakfun tutorial on this). That code was for a temperature data logger recording to an SD card and using a real time clock for the recording timestamps. The DS1307 real time clock is known to drift a bit each day, so the code I found on this website synchronized the real time clock to a NTP (network time protocol) server once per day to keep everything on time.
The SD card recording and the timestamp functions have become redundant in my implementation. The reason for this is that I now have the datalogger sending each reading to the Phant server of data.sparkfun.com. This service replaces the SD card and automatically adds a timestamp to each sensor reading my datalogger sends it. This service is very cool. In the Arduino code I have included below I have left the SD card, real time clock and NTP synchronizing functions in. This is for reference. By leaving them in I effectively have a local backup of my temperature readings, but if I didn’t need that I could remove these functions and rely solely on the Phant server. This would of course free up some space on the Arduino. For now I will leave it in.
Once you understand what the Phant server is and how it works you should read this post on their website Graphing Live Data With Google Charts. I took the example code on that page and manually encapsulated it, one line at a time, within the part of my Arduino code that generates the little website. This then generated a simple but sleek Google Chart from my data stored on the Phant server at data.sparkfun.com. You should also be sure to read the tutorial on the sparkfun website about pushing your data to their Phant server.
The code below is what I have running on my Arduino Mega with Ethernet shield, except for the website text and the privateKey used for uploading data. If you upload this to your Arduino you should end up with it servering a website with my graph on it. You will need to change the publicKey and privateKey fields to match that which you are provided with when you set up an account at data.sparkfun.com. You need to do this in two places. The first is in the encapsulated JavaScript where the publicKey is used to generate the graph. The second is the part of the code where the Arduino sends the data to the Phant server. Do a search for ‘private’ and you will find the two parts you need to change. The same goes for ‘public’ for the publicKey. You also need to change the data stream name or tag from ‘temp’ to whatever you have used when you set up your data.sparkfun.com stream. This needs to be done in two places like for the publicKey, once in the encapsulated JavaScript and once in the Arduino code that sends the data to the Phant server. Do a search in the code for ‘temp’, however only change the ones you need to change. I have included comments on the lines you need to change. If anything goes wrong you really will be better off if you understand how the Arduino code works. You probably will understand it better than I do at this stage so I am sure I am worrying for nothing. You’ll figure it out.
Arduino code extract:
/* This basis of this code was taken from www.bajdi.com see their comments below. I have removed support for the DHT22 sensor (sorry).
 *
 *  I have also used code from the sparkfun tutorial on pushing data to Phant as well as using Phant with Google Charts.
 *  That information can be found at Phant.io and data.sparkfun.com
 *
 *  My page is https://nickstuff.wordpress.com
 *
 *  The modified code presented here includes the following:
 *
 *  - DS18B20 temp sensor
 *  - datalogging to SD card in CSV format
 *  - DS1307 real time clock timestamping
 *  - NTP sync of DS1307 RTC
 *  - Pushing/logging data to Phant server at data.sparkfun.com
 *  - serving a webpage from the Arduino Mega with a Google Chart of the logged data
 *
 *  All credit to where credit is due. The code and blogposts at www.bajdi.com were very helpful.
 *
*/

/*
 http://www.bajdi.com
 SD card temperature logger and webserver with DS1307 RTC.

 This sketch shows how to log data from a DHT22 and DS18B20 sensor to an SD card using the SD library.
 The data from the sensors is updated every 10 seconds and written to the SD card in a CSV file.
 Time stamp is taken from a DS1307 RTC. The data of the DHT22, DS18B20 and RTC is also available on a webserver.
 The time of the DS1307 RTC is synced with a timeserver once a day. (DS1307 is not accurate over a long time.)
 */

#include <SPI.h>
#include <Ethernet.h>
#include <Wire.h>
#include "RTClib.h"
#include <SD.h>
#include <OneWire.h>
#include <DallasTemperature.h>
#include <Udp.h>

unsigned int localPort = 8888;             // local port to listen for UDP packets
IPAddress timeServer(81, 95, 126, 170);    // be.pool.ntp.org NTP server
const int NTP_PACKET_SIZE = 48;            // NTP time stamp is in the first 48 bytes of the message
byte pb[NTP_PACKET_SIZE];                  // buffer to hold incoming and outgoing packets

EthernetUDP Udp;

const int ONE_WIRE_BUS = 12;                // signal pin of DS18B20 connected to pin 12
OneWire ourWire(ONE_WIRE_BUS);
DallasTemperature sensors(&ourWire);

RTC_DS1307 RTC;

byte mac[] = {
  0xDE, 0xAD, 0xBE, 0xEF, 0xFE, 0xED
};
IPAddress ip(192, 168, 2, 188);

int lastTime = -1;
int lastTime2 = -1;

float temp;            // float for temperature value from DS18B20

char filename[] = "00000000.CSV";

EthernetServer server(80);

const int chipSelect = 4;      // CS for SD card

//Phant stuff:
const String publicKey = "123456789";                 //This is where you need to enter your publicKey for uploading your data to the Phant server
const String privateKey = "123456789";                //This is where you need to enter your privateKey for uploading your data to the Phant server
char phantserver[] = "data.sparkfun.com";             //Remote host site for Phant
const byte NUM_FIELDS = 1;                            //You can add extra fields but then you must list them on the next line. Read the tutorial at sparkfun! It will help.
const String fieldNames[NUM_FIELDS] = {"temp"};       //This has to be the same as the field you set up when you made the data.sparkfun.com account i.e. replace "temp" with what you used.
String fieldData[NUM_FIELDS];

String name = "WindowArduino";                        //Your Arduino's name (no spaces), I don't actually know what the significane of this is. The code I used from the sparkfun tutorial inlcuded it. I believe it has to do with some other functionality they included but which I left out.
boolean newName = true;

void setup()
{
  Serial.begin(9600);
  Ethernet.begin(mac, ip);
  server.begin();
  Wire.begin();
  sensors.begin();            // for DS18B20 sensor
  delay(200);
  if (! RTC.isrunning()) {
    Serial.println("RTC is NOT running!");
    RTC.adjust(DateTime(__DATE__, __TIME__));
  }
  delay(100);
  Serial.print("Initializing SD card...");
  pinMode(10, OUTPUT);

  // see if the card is present and can be initialized:
  if (!SD.begin(chipSelect)) {
    Serial.println("Card failed, or not present");
    // don't do anything more:
    return;
  }
  Serial.println("card initialized.");
}

void loop()
{
  DateTime now = RTC.now();                              // get time from RTC

  int time = now.minute();
  if (abs(time - lastTime) > 5)
  {

    sensors.requestTemperatures();                         // get data from DS18B20
    temp = sensors.getTempCByIndex(0);

    getFilename(filename);
    File dataFile = SD.open(filename, FILE_WRITE);

    // if the file is available, write to it:
    if (dataFile) {
      dataFile.print(now.day(), DEC);
      dataFile.print('/');
      dataFile.print(now.month(), DEC);
      dataFile.print('/');
      dataFile.print(now.year(), DEC);
      dataFile.print(" , ");
      dataFile.print(now.hour(), DEC);
      dataFile.print(':');
      dataFile.print(now.minute(), DEC);
      dataFile.print(" , ");

      dataFile.print(" , ");
      dataFile.println((float)temp);
      dataFile.close();

      fieldData[0] = String((float)temp);

      Serial.println(F("Posting!"));
      postData();
      delay(1000);
    }
    // if the file isn't open, pop up an error:
    else {
      Serial.print("error opening ");
      Serial.println(filename);
    }
    lastTime = time;
  }

  EthernetClient client = server.available();
  if (client) {
    // an http request ends with a blank line
    boolean currentLineIsBlank = true;
    while (client.connected()) {
      if (client.available()) {
        char c = client.read();
        if (c == '\n' && currentLineIsBlank) {
          // send a standard http response header
          client.println("HTTP/1.1 200 OK");
          client.println("Content-Type: text/html");
          client.println();

          client.println("<center>");
          client.println("
<h1>");
          client.print("My Temperature Datalogger");
          client.println("</h1>
");
          client.println("</center>");
          client.println("
");
          client.println("

");
          client.print("The outside temperature at my home on the moon, as measured by a DS18B20 sensor");
          client.println("

");
          client.println("
");
          client.print("The date and time of the latest reading is: ");
          //          client.println("
");
          client.print(now.day(), DEC);
          client.print('/');
          client.print(now.month(), DEC);
          client.print('/');
          client.print(now.year(), DEC);
          client.print(' ');
          client.print(now.hour(), DEC);
          client.print(':');
          client.print(now.minute(), DEC);
          client.print(" Central European Summer Time");
          //          client.print(now.second(), DEC);
          client.println("
");

          client.println("
");
          client.println("<center>");
          client.print("The temperature here is: ");
          //  client.println("br />");
          client.println("
<h1>");
          client.println("<font color=\"red\">");     //Used two backslashes here to deal with the quote within a quote problem
          client.print(temp);
          client.print(" °C");
          client.println("</h1>
");
          client.println("</font>");
          client.print("&#177 0.5 °C");
          client.println("</center>");
          client.println("
");

          //**

          client.println("<script src=\"https://ajax.googleapis.com/ajax/libs/jquery/1.11.1/jquery.min.js\"></script>");
          client.println("<script src=\"https://www.google.com/jsapi\"></script>");

          client.println("<script>");

          client.println("function drawChart() {");

          client.println("var public_key = 'KJ7j7qamNos0dxwlV1m1';");             //This is where you need to put your publicKey from data.sparkfun.com to get the google Chart to display your data. Make sure there is some data to display. I will leave my public key here so you can test this part works.

          client.println("var jsonData = $.ajax({");
          client.println("url: 'https://data.sparkfun.com/output/' + public_key + '.json',");
          client.println("data: {page: 1},");
          client.println("dataType: 'jsonp',");
          client.println("}).done(function (results) {");

          client.println("var data = new google.visualization.DataTable();");

          client.println("data.addColumn('datetime', 'Time');");
          client.println("data.addColumn('number', '*C');");                  //I've used '*C' here for celcius. For the life of me I could not get the proper symbol to wok in JavaScript part but I could in the regular html part.

          client.println("$.each(results, function (i, row) {");
          client.println("data.addRow([");
          client.println("(new Date(row.timestamp)),");
          client.println("parseFloat(row.temp),");

          client.println("]);");
          client.println("});");

          client.println("var chart = new google.visualization.LineChart($('#chart').get(0));");

          client.println("chart.draw(data, {");
          //client.println("title: 'My Temperature Sensor'");      //you can add and enable a title to the chart here.
          client.println("});");

          client.println("});");

          client.println("}");

          client.println("google.load('visualization', '1', {");
          client.println("packages: ['corechart']");
          client.println("});");

          client.println("google.setOnLoadCallback(drawChart);");

          client.println("</script>");

          //          client.println("</head>");
          client.println("<body>");
          client.println("
<div id=\"chart\" style=\"width: 100%;\"></div>
");    //you can change the width of the chart here.
          client.println("</body>");
          //          client.println("</html>");

          //**

          client.println("

");
          client.print("Paragraph text Blah blah blah. Insert your own text here!.");
          client.println("

");

          break;
        }
        if (c == '\n') {
          // you're starting a new line
          currentLineIsBlank = true;
        }
        else if (c != '\r') {
          // you've gotten a character on the current line
          currentLineIsBlank = false;
        }
      }
    }
    // give the web browser time to receive the data
    delay(1);
    // close the connection:
    client.stop();
  }

  int time2 = now.day();
  if (abs(time2 - lastTime2) > 1)
  {
    Udp.begin(localPort);
    delay(250);
    // send an NTP packet to a time server
    sendNTPpacket(timeServer);

    // wait to see if a reply is available
    delay(1000);

    if ( Udp.parsePacket() ) {
      // read the packet into the buffer

      Udp.read(pb, NTP_PACKET_SIZE);

      // NTP contains four timestamps with an integer part and a fraction part
      // we only use the integer part here
      unsigned long t1, t2, t3, t4;
      t1 = t2 = t3 = t4 = 0;
      for (int i = 0; i < 4; i++)
      {
        t1 = t1 << 8 | pb[16 + i];
        t2 = t2 << 8 | pb[24 + i];
        t3 = t3 << 8 | pb[32 + i];
        t4 = t4 << 8 | pb[40 + i]; } // part of the fractional part // could be 4 bytes but this is more precise than the 1307 RTC // which has a precision of ONE second // in fact one byte is sufficient for 1307 float f1, f2, f3, f4; f1 = ((long)pb[20] * 256 + pb[21]) / 65536.0; f2 = ((long)pb[28] * 256 + pb[29]) / 65536.0; f3 = ((long)pb[36] * 256 + pb[37]) / 65536.0; f4 = ((long)pb[44] * 256 + pb[45]) / 65536.0; const unsigned long seventyYears = 2208988800UL; t1 -= seventyYears; t2 -= seventyYears; t3 -= seventyYears; t4 -= seventyYears; // Adjust timezone and DST //I didn't write this comment. I think the last person added this 4 hour comment. It works for me in Europe with the correct time. I am not from Chile // or work in UTC? t4 += (2 * 3600L); // Notice the L for long calculations!! t4 += 1; // adjust the delay(1000) at begin of loop! if (f4 > 0.4) t4++;    // adjust fractional part, see above
      RTC.adjust(DateTime(t4));

      Serial.println("RTC synced");
    }
    lastTime2 = time2;
  }

}

void getFilename(char *filename) {
  DateTime now = RTC.now();
  int year = now.year();
  int month = now.month();
  int day = now.day();
  filename[0] = '2';
  filename[1] = '0';
  filename[2] = (year - 2000) / 10 + '0';
  filename[3] = year % 10 + '0';
  filename[4] = month / 10 + '0';
  filename[5] = month % 10 + '0';
  filename[6] = day / 10 + '0';
  filename[7] = day % 10 + '0';
  filename[8] = '.';
  filename[9] = 'C';
  filename[10] = 'S';
  filename[11] = 'V';
  return;
}

// send an NTP request to the time server at the given address
unsigned long sendNTPpacket(IPAddress& address)
{
  // set all bytes in the buffer to 0
  memset(pb, 0, NTP_PACKET_SIZE);
  // Initialize values needed to form NTP request
  // (see URL above for details on the packets)
  pb[0] = 0b11100011;   // LI, Version, Mode
  pb[1] = 0;     // Stratum, or type of clock
  pb[2] = 6;     // Polling Interval
  pb[3] = 0xEC;  // Peer Clock Precision
  // 8 bytes of zero for Root Delay & Root Dispersion
  pb[12]  = 49;
  pb[13]  = 0x4E;
  pb[14]  = 49;
  pb[15]  = 52;

  // all NTP fields have been given values, now
  // you can send a packet requesting a timestamp:
  Udp.beginPacket(address, 123); //NTP requests are to port 123
  Udp.write(pb, NTP_PACKET_SIZE);
  Udp.endPacket();
}

void postData()                         //Here is the part of the code that sends the sensor readings to the data.sparkfun.com Phant server
{
  EthernetClient client;

  if (client.connect(phantserver, 80))
  {
    Serial.println(F("Connected"));

    // Post the data! Request should look a little something like:
    // GET /input/publicKey?private_key=privateKey&light=1024&switch=0&time=5201 HTTP/1.1\n
    // Host: data.sparkfun.com\n
    // Connection: close\n
    // \n
    client.print("GET /input/");
    client.print(publicKey);
    client.print("?private_key=");
    client.print(privateKey);
    for (int i = 0; i < NUM_FIELDS; i++)
    {
      client.print("&");
      client.print(fieldNames[i]);
      client.print("=");
      client.print(fieldData[i]);
    }
    client.println(" HTTP/1.1");
    client.print("Host: ");
    client.println(phantserver);
    client.println("Connection: close");
    client.println();

    // While we're connected, print out anything the server sends:
    while (client.connected())
    {
      if (client.available())
      {
        char c = client.read();
        Serial.print(c);
      }
    }
    Serial.println();
  }
  else // If the connection failed, print a message:
  {
    Serial.println(F("Connection failed"));
  }

  // If we're disconnected, stop the client:
  if (!client.connected())
  {
    Serial.println(F("Disconnecting."));
    client.stop();
  }
}
References
Bajdi.com, Arduino temperature logging and webserver with RTC (15 April 2012)
Bajdi.com, Syncing DS1307 RTC with timeserver (1 May 2012)
Pushing Data to Data.SparkFun.com (undated)
Phant.io, Graphing Live Data With Google Charts (7 July 2014)

i was wondering if you still have this working im trying to get it to work and during upload im getting a ton of error: missing terminating ” character errors
Any suggestions
LikeLike
G’day Shane,
Mine is working.
Can you please send me a cut and paste of your code exactly as you have it. Just so we are in the same page. Send it via the contacts page.
I’ll take a look today.
Nick
LikeLike